Every dashboard puts average order value near the top, so it gets treated like a scoreboard. AOV up, good quarter. AOV down, something's wrong. But a rising AOV can be a false win, and we've watched brands celebrate a number going up while the actual profit went down.
The reason is simple once you say it out loud. AOV tells you what the customer spent. It says nothing about what you kept.
How email pushes AOV up (and margin down)
Two levers show up in almost every email calendar: bundles and free shipping thresholds. Both work. Bundle three things at 20% off and people buy three things. Set free shipping at $50 and people build a cart to $52. AOV climbs almost every time.
What also happens is that you've now attached a deeper discount and a shipping cost to your biggest orders. So a bigger order at a heavier discount can leave you with less profit than a smaller order at full price. Brands miss this a lot of the time because nothing in the reporting flags it. The campaign looks like a winner. Revenue per recipient is up. Nobody goes back and asks what the order actually earned.
The math on two orders
Here's the version we sketch out on calls. Same brand, same products, two different orders.
A $60 cart with 20% off and free shipping collects $48. Take out product cost (call it 35% of full retail, so $21), the $9 you just ate on shipping, roughly 3% in payment fees, and a couple bucks to pick and pack it. You kept about $14.56.
A $38 cart at full price with the customer covering shipping collects $38. Product cost is $13.30, no shipping to absorb, same fee structure, same pick and pack. You kept about $21.56.
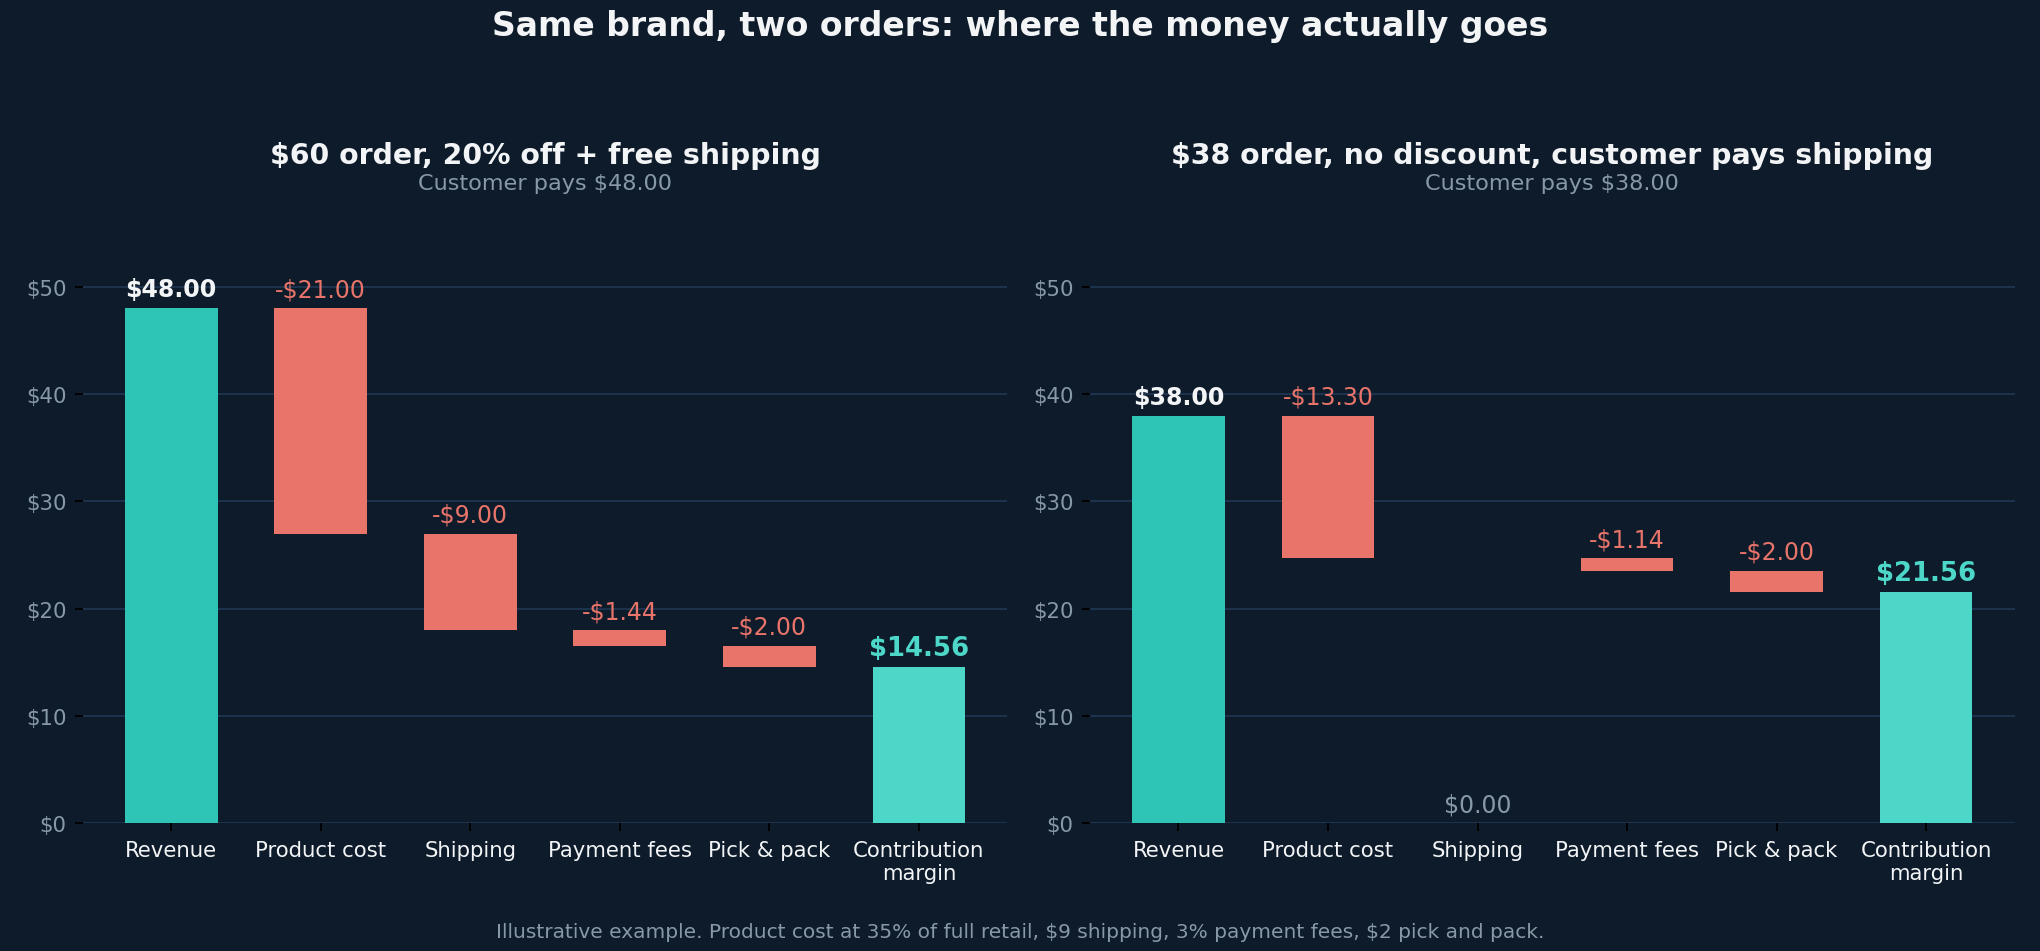
The bigger order lost you about $7. And in the AOV column, it looks like the better one. We've seen this exact scenario play out - the discounted, free-shipped order wins the metric and loses the money.
Your numbers won't be these numbers. Product cost, shipping zones, and fulfillment costs vary a lot. That's the point. You have to run it with your own inputs, because the ranking flips depending on how heavy your shipping is and how deep the discount goes.
AOV is a vanity number dressed up as a performance number
That's the honest description. It's easy to move, it's easy to report, and it goes in the direction you want when you discount harder. Vanity numbers aren't useless, they're just not decision numbers.
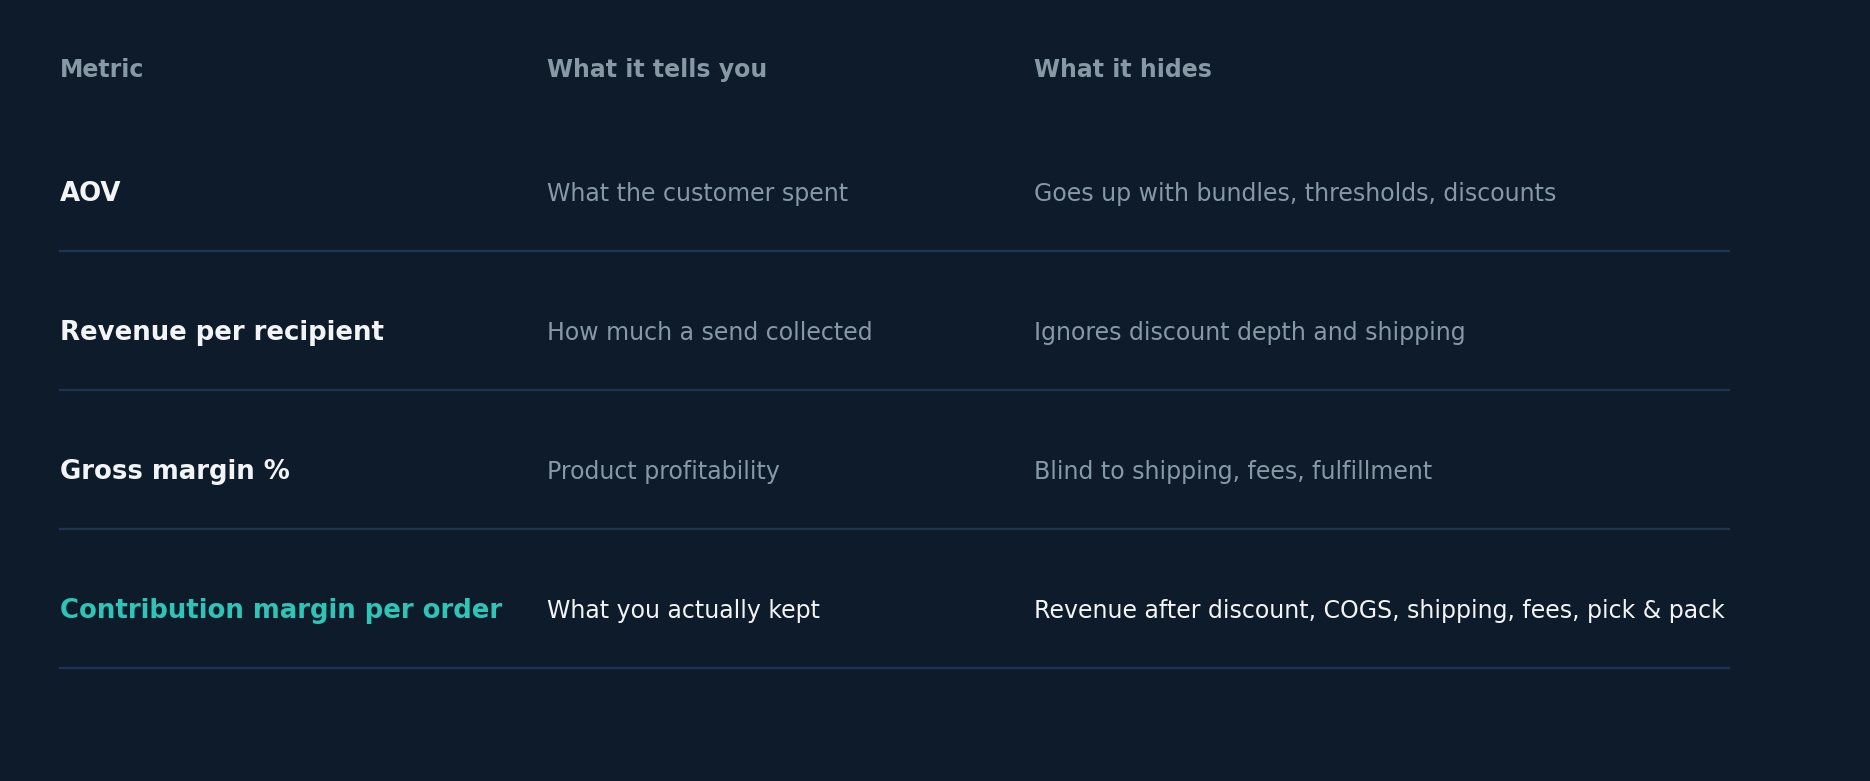
Contribution margin per order is what tells us whether a campaign or a flow made money. Revenue after the discount, minus product cost, minus shipping you absorbed, minus payment fees, minus fulfillment. Everything else is background information.
What to do about it
You don't need a finance rebuild to get this. A few things that usually get you most of the way there:
- Pick one contribution margin figure per product tier and write it down. Not per SKU, not perfect - typical product cost, typical shipping cost, fees, fulfillment. Good enough beats not doing it.
- Score campaigns on margin, not revenue. Pull the orders attributed to a send, subtract the discount you actually gave and the shipping you actually ate, and compare that against a full-price baseline.
- Check your free shipping threshold against real shipping cost. If your average parcel costs $9 to move and your threshold is $50, you're giving up a big slice of a thin order.
- Stop stacking. Bundle discount plus free shipping plus a welcome offer on the same order is where margin quietly disappears.
- Watch AOV and margin per order side by side. When AOV climbs and margin per order doesn't, you found a discount problem, not a growth story.
The flows worth building are usually the ones that raise cart size without buying it. Cross-sells based on what someone already bought, replenishment timing, tiered gifts that cost you less than a shipping subsidy. Those move AOV and margin in the same direction, which is the only version that counts.
If your dashboard says AOV is up and the bank account disagrees, that gap is the whole story. Go find what it cost you to buy that number.


